01
DataHubs
Configure and monitor industrial and enterprise source connections through a common connectivity layer.


Industrial Operational Data Platform
Securely acquire, contextualize, calculate, store, visualize, and distribute industrial data through one operational platform—from plant-floor sources to engineering, dashboards, enterprise systems, and cloud analytics.
One Industrial Data Workflow
ProcessData.IO brings industrial connectivity, data acquisition, engineering context, calculations, visualization, continuous monitoring, historical analytics, security, diagnostics, and downstream data delivery together in one operational data platform.
It supports edge, on-premise, hybrid, and cloud deployments, with resilient operational data storage across local and cloud environments and secure-by-design access for users, applications, real-time services, and analytics workflows.
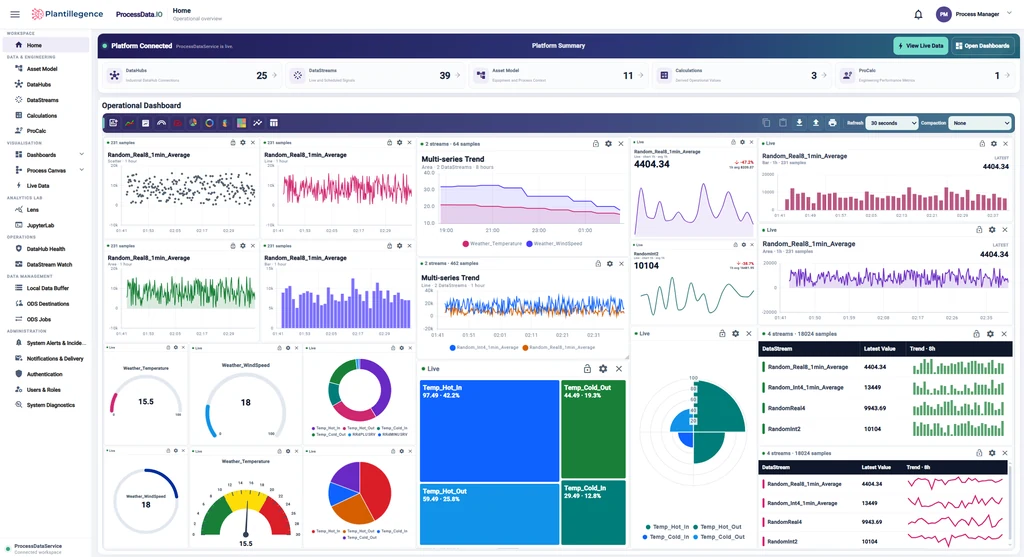
Platform Capabilities
The platform spans source connectivity, acquisition, engineering calculations, asset context, continuous DataStream monitoring, historical analysis, visualization, administration, diagnostics, and external data distribution.
DataHub Connectivity
DataHubs separate source-system connection configuration from individual DataStreams, so many process tags can share a managed source connection.
Database access technologies supporting Microsoft® SQL Server®, Oracle®, PostgreSQL®, and MySQL®.
See It In Action
One interactive tour of ProcessData.IO — from connectivity and calculations to dashboards, the operational data store, and security. Pick an area, then browse its screens.
Configure and monitor DataHub source connections and reliability across the plant.
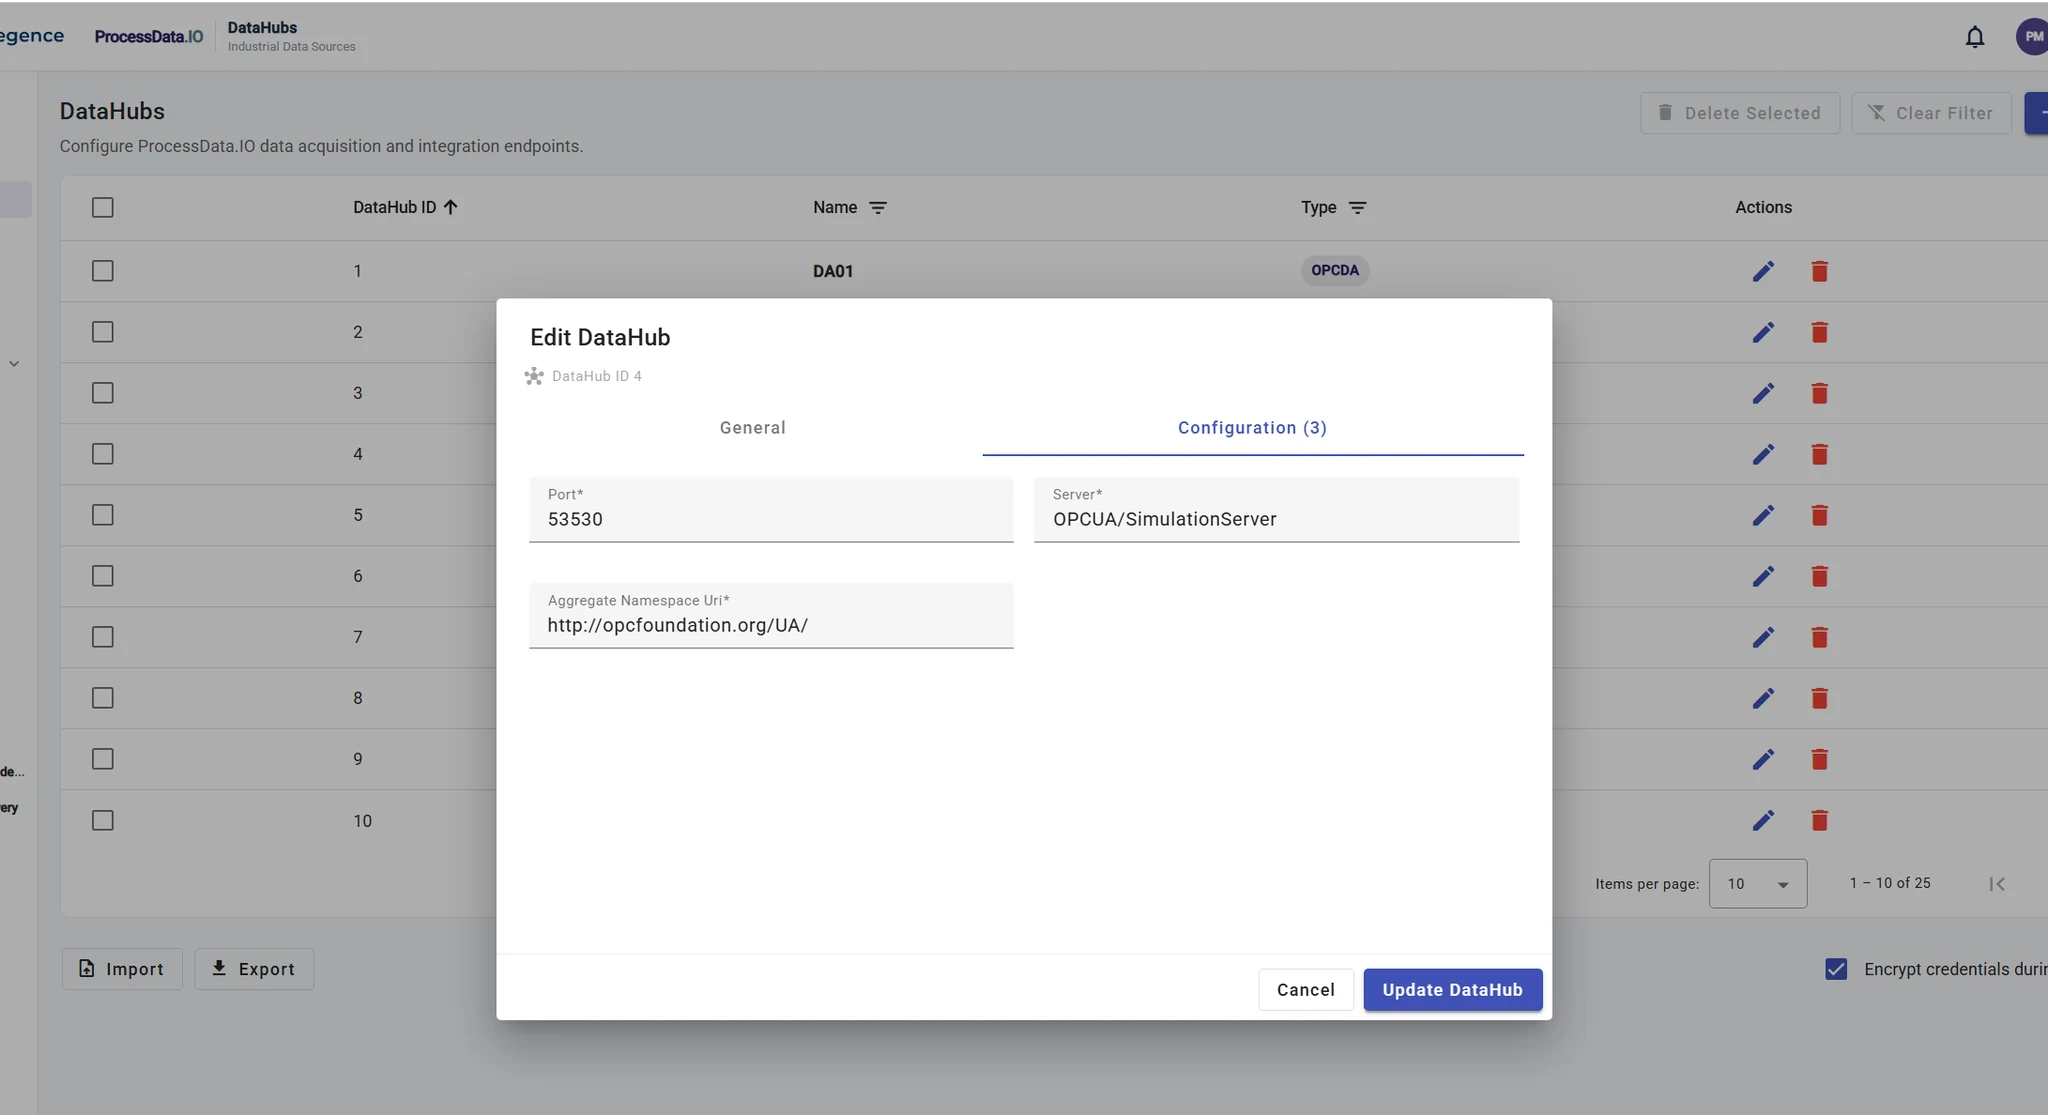
DataHub Management
Operational Monitoring
ProcessData.IO extends DataHub connectivity with operational health visibility, incident workflows, and delivery-channel diagnostics so teams can detect issues and respond quickly.
Track availability, reconnect activity, uptime, downtime, failure rate, operations count, and recent connector events across all configured DataHubs.
Configure health rules, review incidents, filter by severity and DataHub, acknowledge events, and keep operators informed when abnormal conditions are detected.
Manage delivery channels, escalation policies, queue diagnostics, and in-app events for email, webhook, and operational notification workflows.
Acquisition & Persistence
DataStreams are the common process-data layer used by calculations, charts, dashboards, ODS synchronization, and analytics.
Engineering Context
Build formula-based calculated DataStreams using NCalc, input references, dependency handling, schedules, and persisted calculated history.
Build user-configurable engineering methodologies as reusable templates with any required inputs, constants, formulas, and multiple named results. Create calculation instances by mapping template inputs to DataStreams or constants, then schedule and persist the resulting output DataStreams.
Define reusable Asset Masters and instances, build hierarchy, associate DataStreams, and add operational context for equipment analytics and digital-twin workflows.
Operational Data Store
ODS synchronization runs as backend jobs with batching, scheduling, destination-specific writers, failure handling, health, and last-sync state.
Destination configuration supports enable/disable, credentials, TLS/SSL options, batching, maximum batches per run, synchronization interval, checkpoints, destination health, and destination-specific settings.
Visualization
Charts and dashboards are backed by ProcessDataService APIs so configuration can survive browser restart, UI restart, cache cleanup, and reconnection.
Create multiple dashboards and tabs with persistent widget layout and configuration.
View current DataStream values, engineering units, quality, and status through compact operational interfaces.
Query multiple DataStreams, history, groups, and time ranges with configurable refresh from approximately 5 to 600 seconds.
Check analytics-environment status and provide controlled access to notebook-based engineering and data-science workflows.
Lens · Historical Data Analysis
Lens provides an interactive engineering workbench for exploring historical DataStreams, preparing analysis-ready working data, isolating operating periods, discovering relationships, and finding recurring behavior while preserving the original historian samples.
Work with a rolling historian window, freeze analysis at a selected historical cut-off, or import Lens Work, JSON, and CSV datasets for offline investigation.
Compare raw and working views, exclude individual points or selected areas, undo exclusions, and restore samples without modifying the underlying historian data.
Prepare working datasets with moving-average, EMA, or median smoothing, Hampel outlier suppression, and dedicated data-quality review.
Investigate relationships between selected process signals and create formula-based derived analysis variables for engineering exploration.
Define operating conditions, group matching periods into capsules, review them in tabular form, and compare selected operating periods or process behavior.
Search historical data for similar patterns, save Lens configuration, and export or re-import Lens Work with raw data so investigations can be reproduced and shared.
Continuous Monitoring · DataStream Watch
DataStream Watch continuously evaluates selected DataStreams on the server. Monitoring, alert evaluation, and incident handling continue independently of dashboards, Lens, and browser sessions so abnormal operating conditions are not dependent on an open user interface.
Alert when a DataStream falls below a configured low limit or rises above a high limit, with hysteresis and sustain behavior to reduce nuisance state changes.
Detect absolute change, percentage change, or excessive rate of change against the accepted signal baseline and incoming samples.
Detect stale DataStreams when no new sample arrives within the configured period, or identify signals that remain inside a small tolerance band for too long.
Review active incidents by severity, DataStream, rule, trigger value, operating window, and opening time, then acknowledge alerts while the condition remains under observation.
Retain triggered, acknowledged, and recovered incidents for operational review, including recovery state and configurable notification on recovery.
Track unread notifications and move directly from an active or historical DataStream alert into Lens for deeper historical investigation of the affected signal.
Watch rules support Information, Warning, High, and Critical severity levels together with configurable trigger delay, hysteresis, cooldown, enable/disable state, and recovery notification behavior.
Dashboards & Widgets
Process Canvas
An interactive workspace for creating process and equipment diagrams and bringing them to life with real-time operational data.
Build plant views using equipment symbols, vessels, columns, pumps, compressors, valves, instruments, connected piping, dynamic values, and level indicators. Bind operational DataStreams directly to dynamic objects and equipment status so the same diagram moves naturally from engineering representation to live operational awareness. Multiple process views can live within a single canvas, so large plants or process areas stay organized into logical sections while remaining part of one operational workspace.
Design the process. Connect the data. See the operation.
Create PFD-style operational views using reusable equipment and instrumentation symbols.
Display current values, levels, measurements, and equipment operating states directly on the process view.
Show running, stopped, open, closed, and transition states using clear operational indications.
Create and edit orthogonal pipe routes with bends, flow direction, equipment connection points, and automatic connection handling.
Engineer the diagram in Design mode and use a clean operational presentation in Live mode.
Organize complex units, areas, or systems into multiple pages within a single Process Canvas.
Configure canvas dimensions, background appearance, grid spacing, grid visibility, and grid styling.
Print clean process views for reviews, discussions, operating documentation, and field use.
What is happening in the process and where?
How is the operation performing?
Process Canvas and Dashboards serve complementary purposes — together they provide both the operational process view and the performance and analytical view of plant data.
Secure By Design
From user sign-in to live industrial data, every browser-facing path runs through encrypted, authenticated, and isolated connections.
Runtime provider discovery from ProcessDataService supports local, directory, OpenID Connect, and SAML-based enterprise authentication.
Administrator for full system access, Engineer for technical configuration, and Operator for primarily read-only operational visualization.
Import or manage users, assign roles, protect the built-in administrator, inspect active sessions, revoke sessions, and close server-side sessions during logout.
Frontend menus adapt to the signed-in role while ProcessDataService enforces access at the API layer.
HTTPS/TLS protects browser and API traffic, LDAPS secures directory authentication, and authenticated WSS protects live-data streaming. JupyterLab is reached only through the same authenticated HTTPS gateway, backed by a token-protected, loopback-isolated notebook service — internal endpoints are never exposed directly to the browser.
Health & Diagnostics
ProcessDataService availability, runtime state, and logging.
DataHub health, DataStream execution state, quality, last communication, and continuous DataStream Watch alert state.
Scheduling state, execution monitoring, duplicate protection, and stale-run cleanup.
Destination health, job state, synchronization status, and failure diagnostics.
Operational database state, authentication state, sessions, and administration diagnostics.
Lens historical-data analysis plus Jupyter® status, controlled launch / access, and shutdown controls where enabled.
Operational health, incident handling, and notification workflows complement the core connectivity, acquisition, dashboard, and ODS capabilities across ProcessData.IO.
Deployment Architecture
Operational core: Connectivity, acquisition, scheduling, calculations, asset context, authentication, diagnostics, visualization, and downstream delivery operate as one coordinated platform.
Operational storage: Current and historical plant information can be maintained locally and synchronized to enterprise and cloud operational data stores.
Secure communications: HTTPS/TLS-ready deployment protects browser and API traffic, with secure WebSocket communication and controlled analytics access.
Integration: API-oriented services expose authentication, DataHubs, DataStreams, DataStream Watch, alerts and notifications, history, calculations, ProCalc templates and instances, assets, charts, dashboards, ODS, analytics access, diagnostics, and health.
Deployment: Supports edge, on-premise, hybrid, and cloud-oriented topologies without tying the operating model to a single infrastructure pattern.
ProcessData.IO
Use ProcessData.IO as a secure industrial data collector, local and cloud operational data layer, configurable engineering calculation platform, contextual asset layer, continuous DataStream monitoring and alerting environment, Lens analysis workbench, visualization environment, and gateway to enterprise or cloud analytics.
* All product names, logos, and brands are property of their respective owners. All company, product and service names used in this website are for identification purposes only. Use of these names, trademarks and brands does not imply endorsement.